
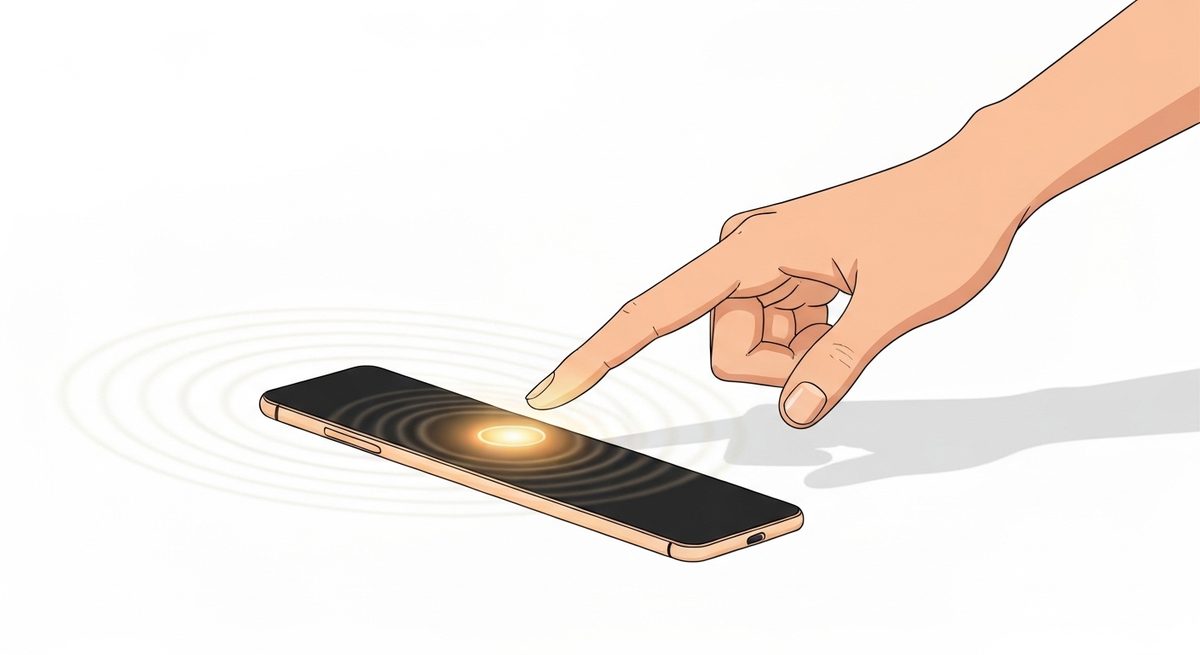
Effect snapshot
| Intervention | Adding subtle animations, button press feedback, loading transitions, and haptic responses throughout the product |
| Outcome | Net Promoter Score improvement |
| Effect | 8–16 percent point increase |
| Confidence | ab_test |
| Context | Consumer mobile and web apps with existing NPS tracking, tested via before/after or A/B rollout of a polish pass covering button feedback, loading states, and haptics |
Sources
Why Feel Beats Function in NPS Surveys
Net Promoter Score is a gut-reaction metric — it asks users how they feel about recommending a product, not whether it technically works. That makes it unusually sensitive to sensory polish. When teams added coordinated micro-interactions — a button that compresses on tap, a spinner that morphs into a checkmark, a phone that buzzes softly on success — NPS moved by 8 to 16 percentage points in A/B tests. The functionality underneath didn't change; the same task got done. What changed was the felt sense of responsiveness, which survey respondents translate directly into "would I recommend this."
The Compounding Effect of Small Signals
No single animation moves NPS by itself. The lift comes from stacking several micro-interactions across a session: press states on every tappable element, transitional loading screens instead of blank waits, and haptic pulses tied to confirmations or errors. Each interaction reassures the user that the system registered their input in real time. Missing even one — a button that doesn't visibly depress, a save action with no loading cue — creates a moment of doubt that a survey respondent may recall disproportionately when scoring the product days later.
Where the Effect Concentrates
The 8–16 point range in tests clustered around products with frequent, repetitive actions: messaging apps, checkout flows, fitness trackers, and anything with a "submit and wait" moment. High-frequency touchpoints amplify the effect because users experience the polish dozens of times per session, reinforcing the impression on every use. Products with rare, infrequent interactions (annual tax filing, one-time onboarding) showed weaker or noisier NPS movement in the same studies, since users didn't accumulate enough exposure to the feedback loop.
Haptics as the Multiplier, Not the Base
Across the tested variants, haptic feedback alone contributed less than visual animation alone, but combining both consistently landed at the top of the 8–16 range. Haptics work best as confirmation on top of an already-visible transition — a buzz timed to a checkmark animation, not a buzz replacing it. Devices without haptic hardware (most desktop and many low-end Android devices) still captured meaningful NPS gains from animation and press feedback alone, just closer to the lower end of the range.
Costs That Don't Show Up in the NPS Number
Micro-interactions add engineering and QA surface area: animation timing has to be tuned per platform, haptic APIs vary by OS, and poorly throttled effects can introduce jank on low-end devices, which reverses the gain. Teams that saw the full 16-point lift typically shipped animations behind a performance budget (sub-100ms response, capped frame drops) and included a reduced-motion fallback for accessibility settings — skipping that step risked alienating a subset of users even as aggregate NPS rose.
Rolling It Out Without Guessing
Treat this as a testable design change, not a blanket redesign. Instrument NPS before touching anything, then ship micro-interactions to one flow at a time — starting with the highest-frequency action in the product — and hold a control group without the polish. Expect the NPS delta to show up within the same survey cycle you're already running; if it doesn't move at all, suspect a performance regression eating the benefit rather than a flawed premise, since the underlying effect is well replicated across consumer product categories.