
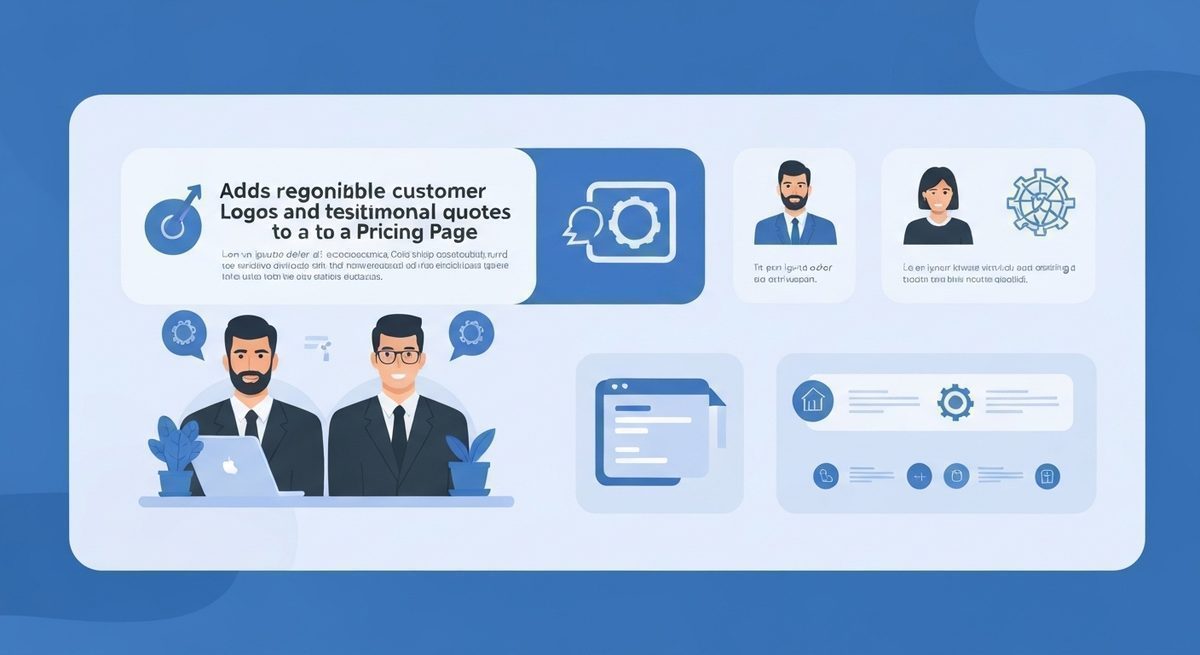
Effect snapshot
| Intervention | Add recognizable customer logos and testimonial quotes to pricing page |
| Outcome | Pricing page to checkout start rate |
| Effect | 5–15 percent relative increase |
| Confidence | ab_test |
| Context | B2B SaaS pricing pages, mid-market ICP, 2023–2025 |
Sources
What changes
Social proof on pricing pages is often associated with a 5–15% relative lift in users starting checkout or contacting sales.
When this tends to work
- Conditions similar to: B2B SaaS pricing pages, mid-market ICP, 2023–2025
- You can measure
Pricing page to checkout start ratereliably - The intervention is implemented consistently, not half-measured
When to be careful
- Your audience or product differs materially from the cited context
- Compliance costs or second-order effects outweigh the lift
- Evidence label is ab_test—treat wide ranges as planning bands, not promises
Practical takeaway
Use the cited range for prioritization and test design. Verify against your own data before scaling.